If you've ever tried to collect IEP data with one generic worksheet for every single goal on your caseload, you already know the problem. A trial-by-trial sheet doesn't work for a toileting routine. A frequency tally doesn't work for a reading fluency goal. And a probe sheet built for one student's IEP almost never survives contact with the next student's completely different goal.
Most special educators don't have a data collection problem — they have a data matching problem. The wrong format doesn't just look messy, it makes the numbers harder to trust when it's time to write a progress report.
This is a practical breakdown of the seven data types that show up across most IEP goals, when to use each one, and how to stop hand-drawing a mastery line on a progress graph every single reporting period.
Why one data sheet doesn't work for every goal
An IEP caseload is rarely one kind of goal. In a single binder you might have:
- A reading comprehension goal that needs an accuracy percentage across a set of trials
- A hand-washing routine goal that's really eight sequential steps, not one right-or-wrong answer
- A behavior reduction goal where the number that matters is how often something happens, or how long it lasts
- A related-service goal from speech or OT tracked on a totally different schedule
Try to force all four onto the same sheet, and you end up either collecting data that doesn't actually answer the IEP question, or spending prep time redesigning a sheet from scratch for every new goal. Neither is sustainable across a full caseload.
The 7 IEP data types, and when to use each one
Here's the practical cheat sheet — what each data type is actually measuring, and the kind of goal it fits.
| Data type | What it measures | Best for |
|---|---|---|
| Trial-by-trial | Correct/incorrect on every single opportunity | Discrete academic skills — sight words, math facts, comprehension questions |
| Probe | A periodic snapshot using a small, consistent item set | Skills you check weekly rather than every session — faster than trial-by-trial, still defensible |
| Task analysis | Independence level on each step of a multi-step sequence | Self-care routines, functional living skills, vocational tasks |
| Frequency | How many times a behavior or response occurs | Behavior goals where count is the meaningful number (call-outs, hand-raises, elopement attempts) |
| Duration | How long a behavior or activity lasts | On-task time, tantrum length, engagement duration |
| Interval | Whether a behavior occurred during fixed time chunks | Behaviors that are hard to count individually but need a rate estimate over a longer observation |
| ABC (Antecedent-Behavior-Consequence) | What happened right before and after a behavior | Function-finding for behavior goals — the "why," not just the "how often" |
Notice none of these is objectively "better" than the others — they answer different questions. The skill isn't picking the fanciest data sheet, it's matching the sheet to what the IEP goal is actually asking you to measure.
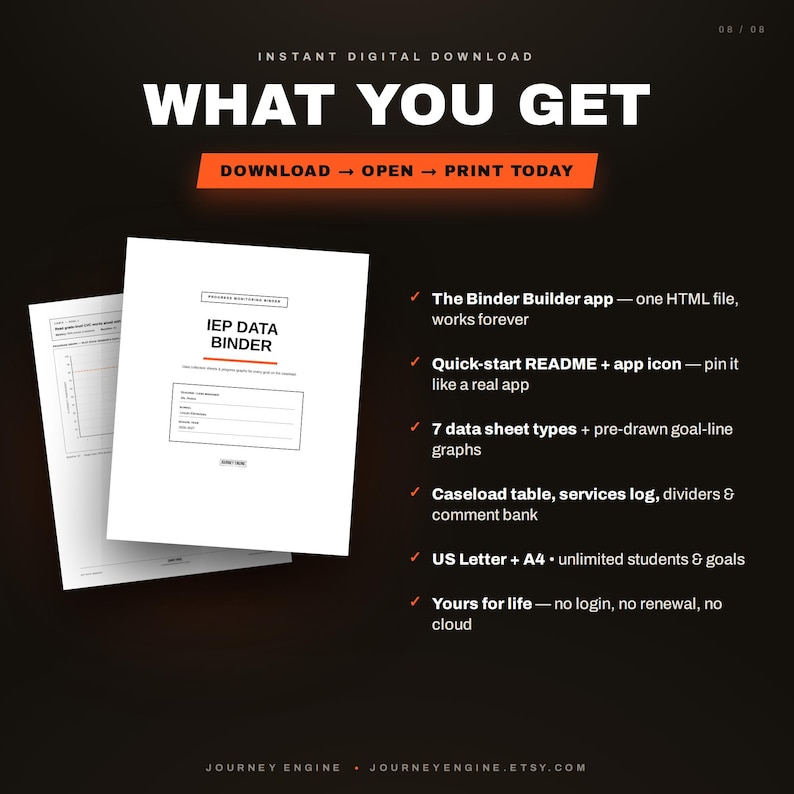
Picking a data type per goal — Probe, Trial, Task Analysis, Frequency, Duration, Interval, or ABC — inside the IEP Data Binder Builder app.
The part nobody tells you: the graph is half the work
Collecting the right data is only step one. For progress reporting, you also need a graph with a mastery line — the flat reference line at the goal's target criterion (say, 80% across 3 consecutive sessions) so a data point trending up toward that line tells the whole story at a glance.
Most teachers either free-hand this line on a printed graph with a ruler, or rebuild a chart in a spreadsheet every reporting period. Multiply that by every goal, for every student, every quarter, and it's easily hours of "administrative" work that has nothing to do with actually teaching.
How the IEP Data Binder Builder fixes this
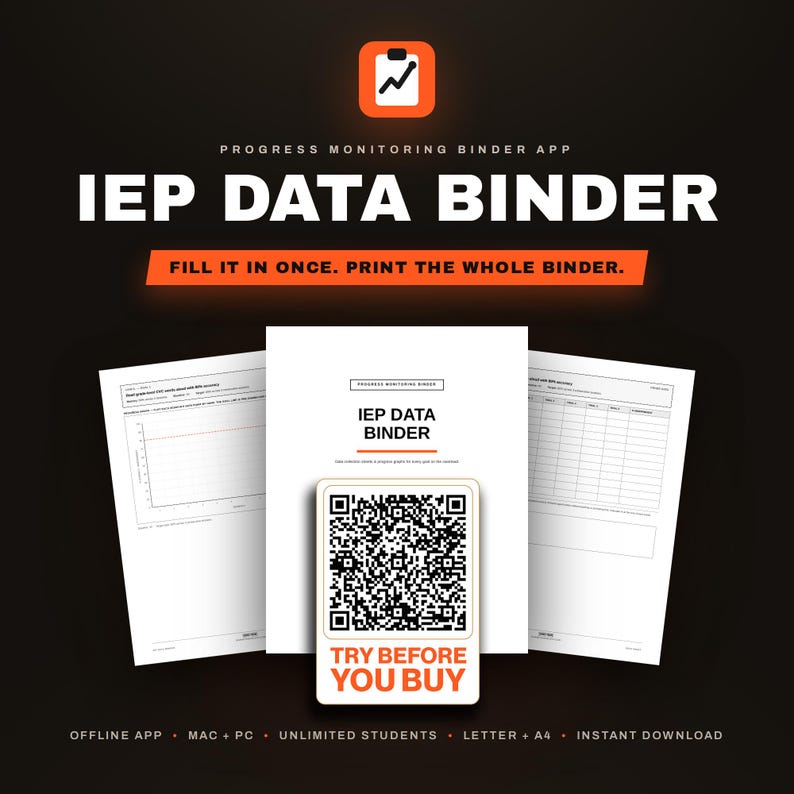
This is exactly the gap the IEP Data Binder Builder app was built to close. You tell it what kind of goal a student has, and it builds the matching sheet — automatically, with the progress graph and mastery line already drawn in.
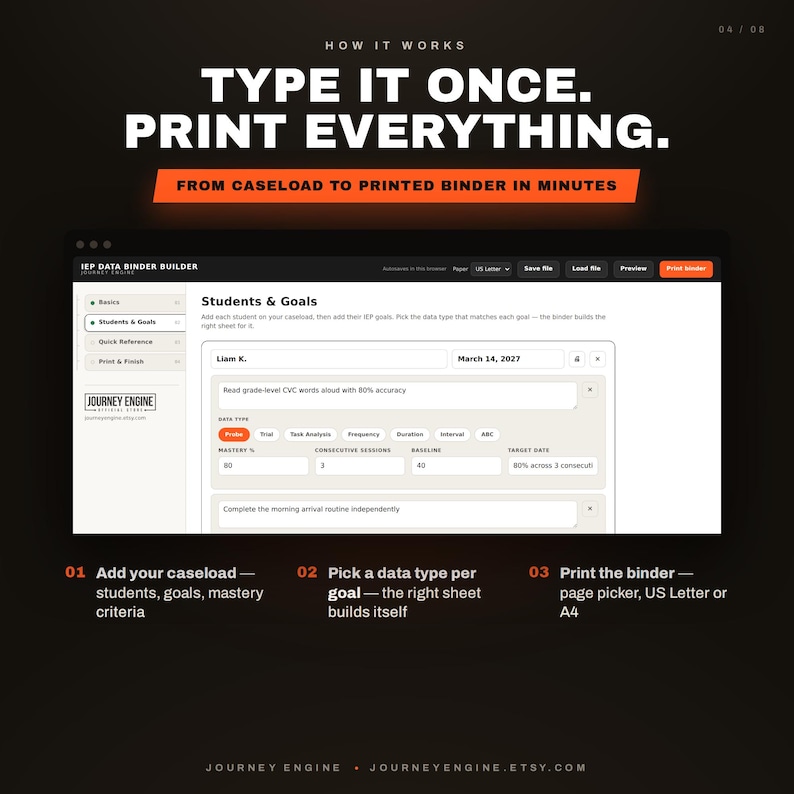
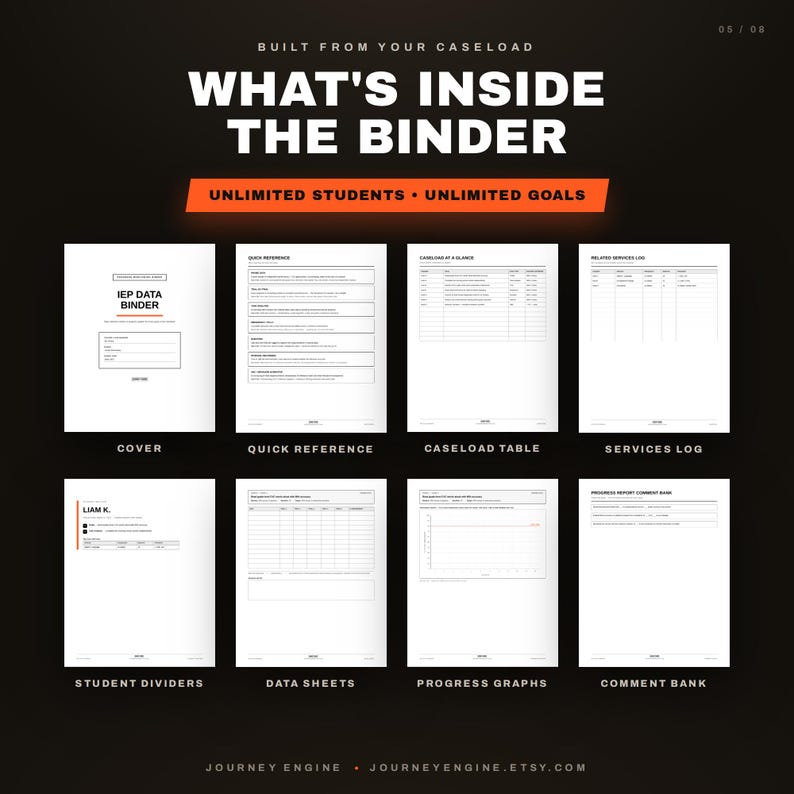
A printed data sheet with the mastery line pre-drawn, and a full caseload-at-a-glance view.
What's actually in it
- The Binder Builder app — one HTML file, opens in any browser, 100% offline, works on Mac or PC
- Add unlimited students and unlimited goals, and pick a data type per goal
- All 7 data-type sheets — trial, probe, task analysis, frequency, duration, interval, ABC — auto-matched to what you picked
- Progress graphs with the mastery-criterion line pre-drawn from the percentage you enter
- A caseload-at-a-glance page, student divider pages, and a related services log for speech/OT/PT/counseling minutes
- A progress report comment bank, so you're not writing narrative summaries from scratch
- Reprint just one student's pages after a goal amendment, without reprinting the whole binder
Fill it in once — the app builds the matching sheet, then prints the whole binder in one pass.
Who this actually helps
- Special education teachers and case managers tired of hand-drawn graphs eating their planning periods
- New SPED teachers building a data system from scratch and don't want to reinvent seven sheet formats
- Anyone with a large caseload who needs this to be fast, not fancy
- BCBAs and ABA providers who want quick trial or task-analysis sheets without a subscription tool
Try it before you commit
The listing includes a QR code / demo link so you can poke around the real app before buying — see how the goal setup, data sheets, and graphs actually work with your own caseload in mind.
Get the IEP Data Binder Builder on Etsy →Instant digital download · one HTML file · unlimited students · yours for life
Frequently asked questions
What kind of data sheet should I use for a reading or academic goal?
Most academic goals — reading comprehension, math computation, sight words — work with trial-by-trial data if you're logging every attempt, or probe data if a periodic snapshot is enough. Trial-by-trial is the most detailed but takes longer to collect; probe data is faster and still holds up for progress reporting.
What's the actual difference between trial-by-trial and probe data?
Trial-by-trial records every single opportunity as it happens, so you get a complete accuracy picture, but it takes more time. Probe data samples performance periodically with a small, consistent set of items — faster to collect, and still shows a reliable trend for goals that don't need trial-level detail.
When should I use task analysis instead of trial data?
Use task analysis for any goal that's really a sequence of steps — a self-care routine, a functional living skill, a multi-step vocational task. You score independence on each step (independent, verbal prompt, physical prompt, no response), because the goal is completing the whole chain, not one isolated response.
How do I track a behavior goal on an IEP?
It depends what the behavior looks like. Frequency data if you're counting occurrences. Duration data if the important number is how long it lasts. Interval data if you're sampling across fixed time chunks over a longer observation. An ABC log if you need to understand triggers and function, not just rate.
Do I have to hand-draw the mastery line every time?
Not if your tool draws it for you. A mastery line is a flat reference at the goal's target criterion, plotted across the reporting period — enter the mastery percentage once and a purpose-built tool can generate it automatically instead of you doing it by hand on every printout.
Is a paid IEP data app worth it over free printable sheets?
Free printables are a fine starting point, but it's usually one generic format you re-adapt by hand for every goal type, with no graphing built in. A paid tool earns its cost once you're managing more than a couple of students, tracking several data types across a caseload, or you're done manually plotting mastery lines every reporting period.